


Visualising noise (data)
A set of visualization as part of a study about the noise levels around the area of Heathrow Airport. The study is focused on uncovering the noise created by the vast network hub that is Heathrow Airport, specifically looking at the sources which create that noise, by breaking down the noises into visual format.
The dataset was built by recording noise levels at different locations in and around the airport building/boundaries. The information recorded has been presented in a visual format in order to communicate the levels of noise.
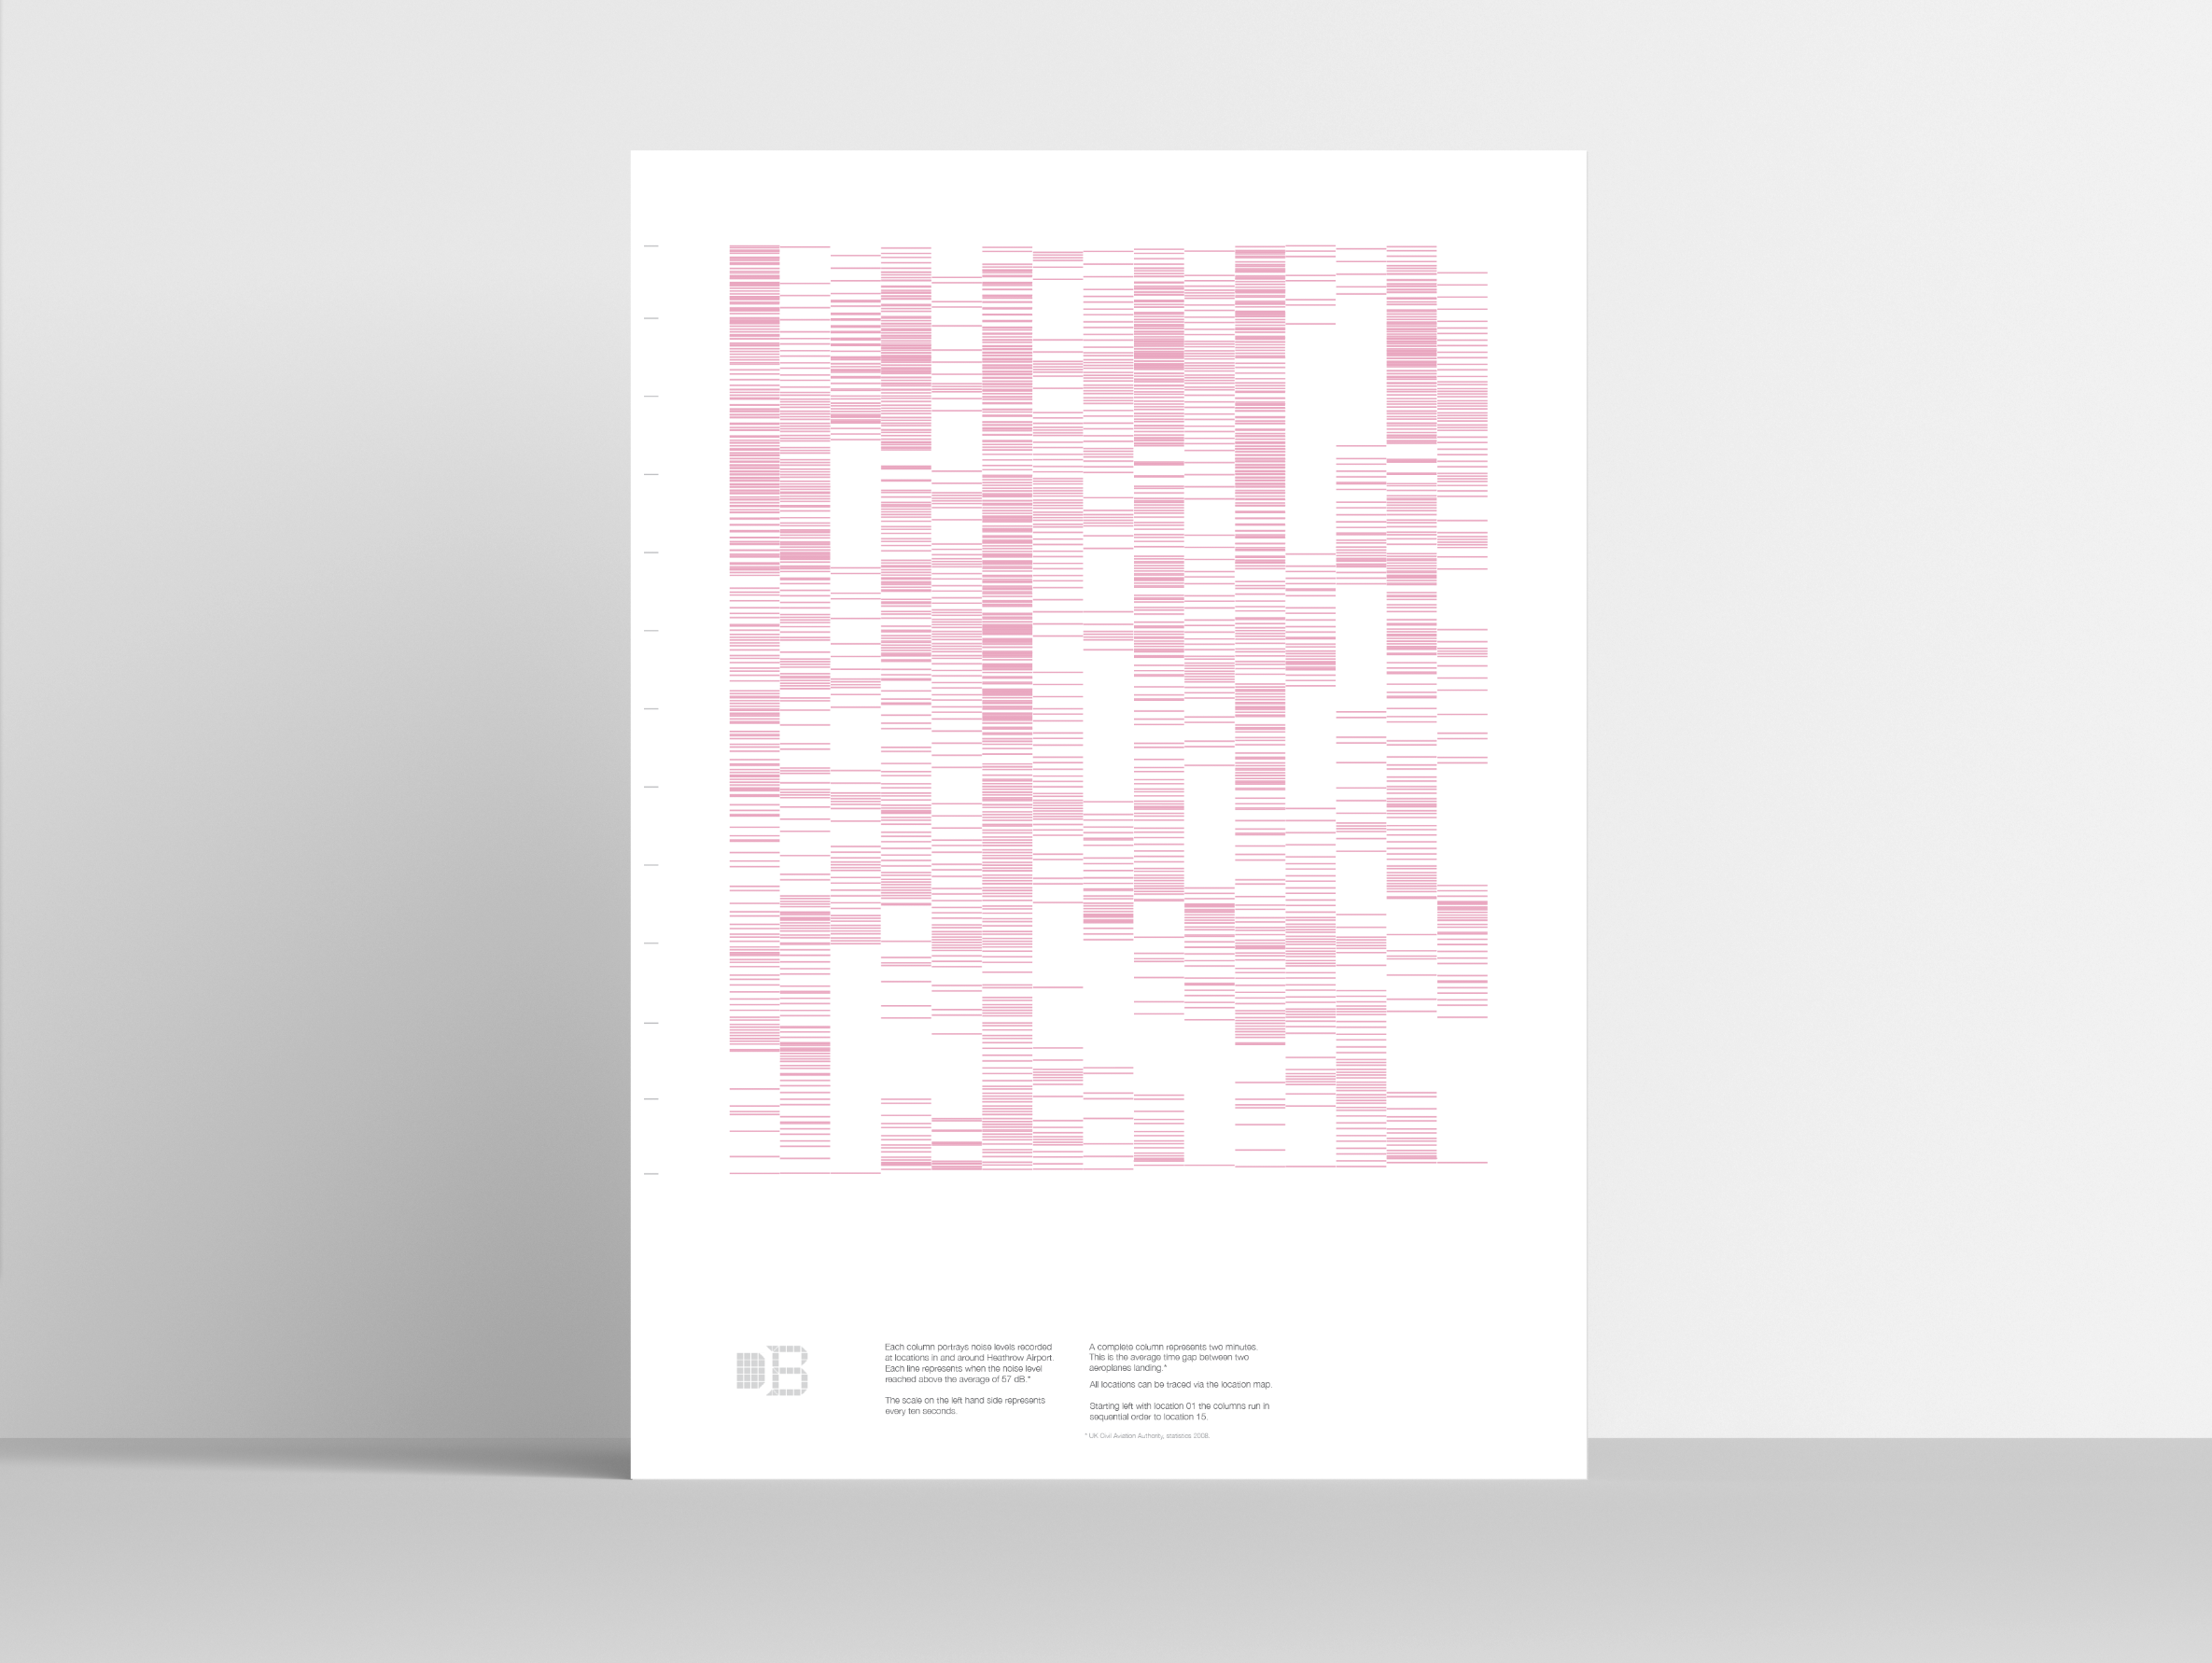
Density
Each column portrays noise levels recorded at locations in and around Heathrow Airport. Each line represents when the noise level reached above the average of 57 dB. The scale on the left hand side represents every ten seconds. All locations can be traced via the location map. Starting left with location 01 the columns run in sequential order to location 15. A complete column represents two minutes.
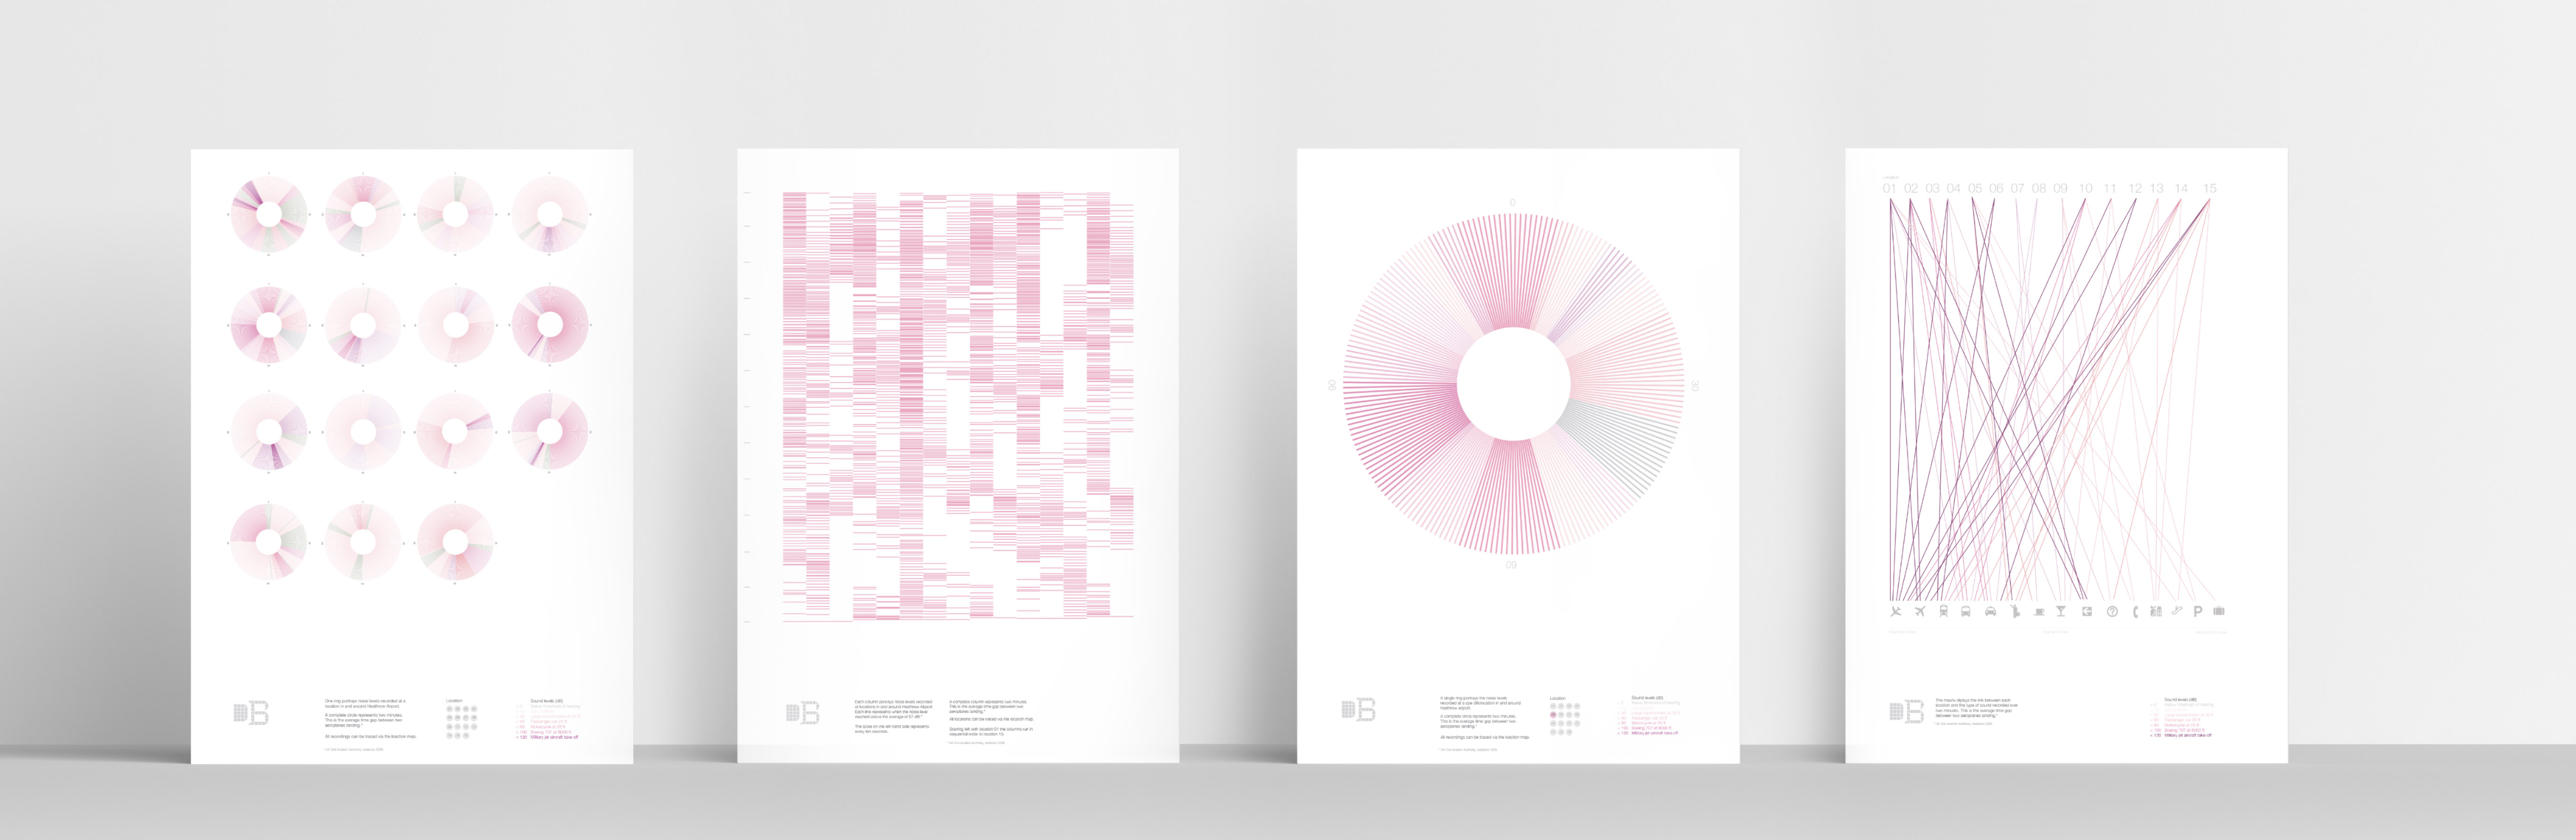
Circles
One ring portrays noise levels recorded at locations in and around Heathrow Airport. A complete circle represents two minutes. This is the average time gap between two aeroplanes landing.
Map
This is a dB noise map of Heathrow Airport runway 1 & 2. The map shows areas with a specific dB level.
Matrix
The matrix displays the links between each location in and around Heathrow Airport. Location and the type of sound recorded over two minuets.
A set of visualization as part of a study about the noise levels around the area of Heathrow Airport. The study is focused on uncovering the noise created by the vast network hub that is Heathrow Airport, specifically looking at the sources which create that noise, by breaking down the noises into visual format.
The dataset was built by recording noise levels at different locations in and around the airport building/boundaries. The information recorded has been presented in a visual format in order to communicate the levels of noise.
Density
Each column portrays noise levels recorded at locations in and around Heathrow Airport. Each line represents when the noise level reached above the average of 57 dB. The scale on the left hand side represents every ten seconds. All locations can be traced via the location map. Starting left with location 01 the columns run in sequential order to location 15. A complete column represents two minutes.
Circles
One ring portrays noise levels recorded at locations in and around Heathrow Airport. A complete circle represents two minutes. This is the average time gap between two aeroplanes landing.
Map
This is a dB noise map of Heathrow Airport runway 1 & 2. The map shows areas with a specific dB level.
Matrix
The matrix displays the links between each location in and around Heathrow Airport. Location and the type of sound recorded over two minuets.